There are times when you want to get a graphical representation of a relational database (say, for instance, the Citrix Resource Manager Summary Database). You could wade through a DBMS management console (such as the Microsoft’s Enterprise Manager for SQL) to get a list of all the tables and primary key/foreign key relationships, then draw out these tables in some kind of graphics software. Or, you could use Microsoft Visio to do all this work for you. All you need is an ODBC connection and Microsoft Visio Professional.
- Open Microsoft Visio Professional and create a new Database Model Diagram.
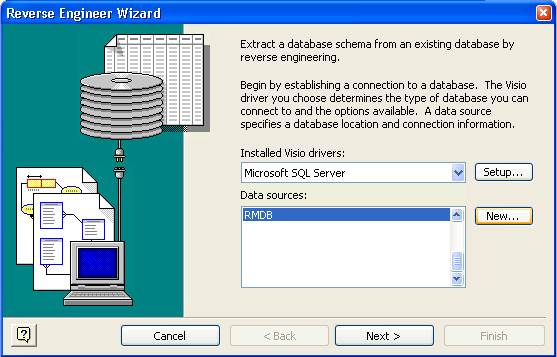
- Click on the Database menu and select Reverse Engineer to start the Reverse Engineer Wizard.
- Select an existing data source (DSN) or create a new one.
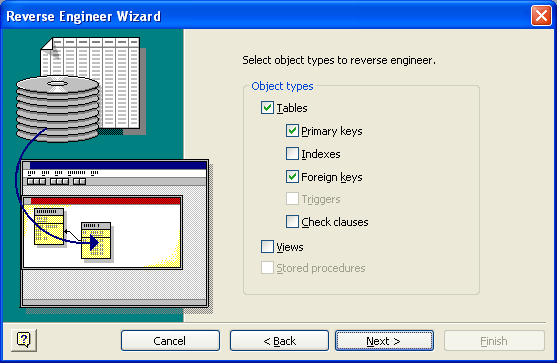
- Select the information you want to add to the drawing. (I chose just the tables, primary keys, and foreign keys in this example).
- Select the checkboxes for the tables (and views, if any) that you want to graph.
- Select whether you want Visio to add the shapes to the drawing. If you don’t let the wizard add the shapes to the page now, you will be able to drag and drop the shapes onto the drawing after the wizard finishes extracting the information.
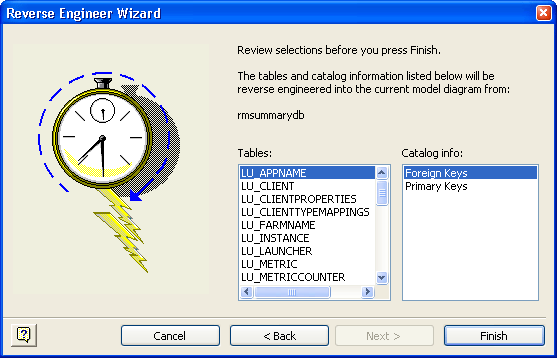
- Review the selections made and click Finish.


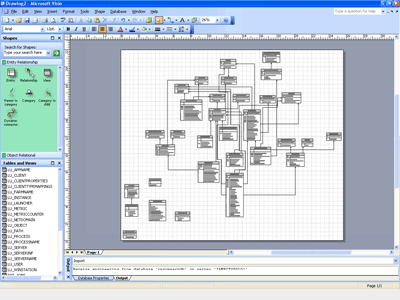
I used the steps in the example demonstrated above to extract the Citrix Resource Manager Summary Database schema. As you can see from the screen shot below, Visio did a great job of extracting the information, but you’ll have to do quite a bit of moving shapes around to get a better picture of the relationships. Fortunately, I’ve already done this for you, and you can download the drawing in the Downloads section here.
One last really cool thing. You can also use Visio’s database features to generate databases from a drawing as well as update databases from a drawing. I often reverse engineer a database, make changes to the drawing, and let Visio make the changes to the database for me. That way my documentation and database structure stay in synch.
