Originally posted on the Splunk official blog: https://www.splunk.com/en_us/blog/tips-and-tricks/event-calendar-custom-visualization.html
Awhile back, I wrote a blog post about using a custom calendar visualization in Simple XML dashboards. To accomplish this, I used a technique sometimes referred to as escape hatching JavaScript into Simple XML. While this works okay for a developer, the technique does not lend itself well to the end user.
Splunk Custom Visualizations Splunk 6.4 introduced reusable custom visualizations which allows a developer to package up a visualization and integrate it into Splunk just like the native visualizations. This also addresses the limitation mentioned above – meaning any end user can use the visualization without mucking around with the Simple XML.
So, revisiting the older escape hatch calendar technique, I thought it would be a good exercise to convert the calendar into a custom visualization. The calendar is now available on Splunkbase, and several new features have been added.
Using the Calendar in Splunk The calendar expects a search exposing _time and a count. The timechart search command does a good job of this. For example, the following search:
index=_internal | timechart span=1d dc(sourcetype) AS sourcetypes dc(source) as sources dc(host) as hosts produces some nice tabular data like so:
calendar_tabular
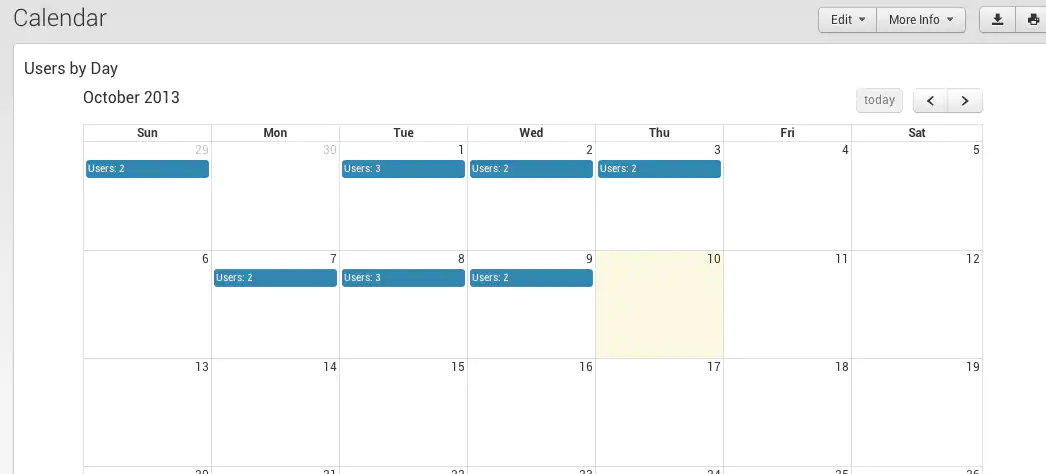
The calendar visualization can take this data and visualize it on a calendar like this:
calendar_blog
There are some formatting options as well.
calendar_format
Try it out yourself and go download it on Splunkbase.
Special shout-out to the Summer Interns who helped… Yue Kang, Nic Stone, and Phillip Tow!
While designing a recent application, I wanted to display how many unique users logged in per day on a monthly basis. This is relatively trivial to do in the Splunk search language, but the visualization of that data usually ends up being a table. I thought it would be more natural to display this information on a calendar, so I set out to get this working with the new Splunk 6 hotness. Here is the result:
The Search
Like I said earlier, the search part of this pretty easy. I am looking in the Windows Security Event Log, but you don’t have to. Really, all we are trying to get to is a list of events that have a date and a count of something.
Anyway, here is the search to find Remote Interactive (Logon_Type=10) successful logon events (EventCode=4624).
index=<some index with Windows events> sourcetype="WinEventLog:Security" EventCode=4624 Logon_Type=10 | bucket _time span=1d | stats dc(Account_Name) AS Users by _time | convert timeformat="%m/%d/%Y" ctime(_time) AS date | stats count by date,Users
For more information on Logon Types, check out this -> http://msdn.microsoft.com/en-us/library/aa380129.aspx
The Simple XML Dashboard
Here is an excerpt from the Simple XML
<div id="eventCalendar"
       class="splunk-view"
       data-require="app/CalendarExample/components/eventcalendar/eventcalendar"
       data-options='{
          "managerid": "calSearch",
          "valueField": "Users",
          "dateField": "date",
          "linkUrl": "/app//day",
          "destFormField": "date"
       }'>
</div>
Note the data-options part. This lets us pass values to the JavaScript running the show behind the scenes. We are passing a URL field so that we can make the data in the calendar days clickable for a drilldown to another Splunk dashboard.
The Visualization Code
The workhorse of all this is a JavaScript file called eventcalendar.js. eventcalendar.js inherits simplesplunkview.js which is located in $SPLUNK_HOME/share/splunk/search_mrsparkle/exposed/js/splunkjs/mvc/.
The real calendar visualization comes form an open-source JavaScript library called FullCalendar found here -> http://arshaw.com/fullcalendar/
In eventcalendar.js, we basically just override 3 methods in order to get the data in a format the FullCalendar expects and update the Splunk View.
formatData: Formats results data from Splunk and returns a handle to the data. createView: Configures the view and returns a handle to it. updateView: Puts Splunk data (returned by the formatData method) into the view (returned by the createView method) and renders it. For more information on this technique see this -> http://dev.splunk.com/view/new-app-framework-preview/SP-CAAAERB
You can download all the code for this project here -> https://github.com/JasonConger/SplunkCalViz