Originally posted on the Splunk official blog: https://www.splunk.com/en_us/blog/tips-and-tricks/pivot-a-single-row-table-with-a-datatemplate-view.html
PowerShell has some cool object formatting features. Two of the most common are called Format-Table and Format-List. You can think of a Splunk Table as a Format-Table view, but what if you want to format your results as a list? This is especially helpful when you have a one-row table that starts to push the boundaries of your screen. Wouldn’t it be nice if you could pivot your table to have the headers as one column and the data as another? Well, with a DataTemplate View, you can do this very easily.
What We Will Be Doing
We will be turning this:

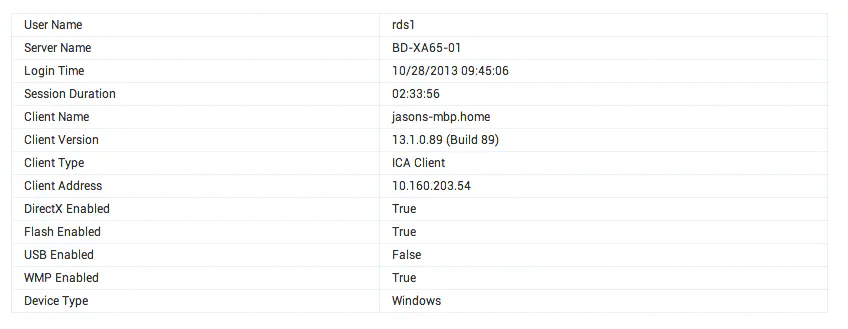
Into this:
How It Is Done – Step 1 – Create a HTML dashboard
The easiest way to get started is to perform a search that creates a table. Something like:
index=_internal | stats latest(sourcetype) AS sourcetype latest(index) as index latest(host) as host latest(source) as source
Then, save this as a new dashboard panel. Finally, convert the dashboard into HTML using Splunk web. Now, you have a HTML/JavaScript version that we can work with.
Step – 2 – Add the DataView components to your dashboard
Open the source of your HTML dashboard and add “splunkjs/mvc/dataview” to your require array like below:
require([ "splunkjs/mvc",
"splunkjs/mvc/utils",
"splunkjs/mvc/tokenutils",
"underscore",
"jquery",
"splunkjs/mvc/dataview",
...
Add DataView to your require function as well:
function( mvc,
utils,
TokenUtils,
DataView,
...
Step 3 – Create an underscore.js template for our table
Here is the one I used – just add this script block above your require script block:
<script type="text/x-underscore-tmpl" id="user-session-template" style="display:none"> <table id="user-session-table">
<tbody>
<%
for(var i=0, l=results.length; i<l; i++) {
var line=results[i];
for(var key in line) {
var attrName = key;
var attrValue = line[key];
%>
<tr>
<td><%= attrName %></td>
<td><%= attrValue %></td>
</tr>
<%
}
}
%>
</tbody>
</table>
</script>
Step 4 – Render the Table
The final step is to render the results.
First, create an element somewhere in your HTML where you want the table to appear. Something like this:
<div id="user-session-details"></div>
Then, look for the search in your HTML dashboard and add this after it
new DataView({ id: "dataview1",
managerid: "search1",
template: $('#user-session-template').html(),
el: $('#user-session-details')
}, {tokens: true}).render();
You can use CSS to make your table look pretty.