Originally posted on the Splunk official blog: https://www.splunk.com/en_us/blog/tips-and-tricks/showhide-a-dashboard-panel-based-on-a-search-results.html
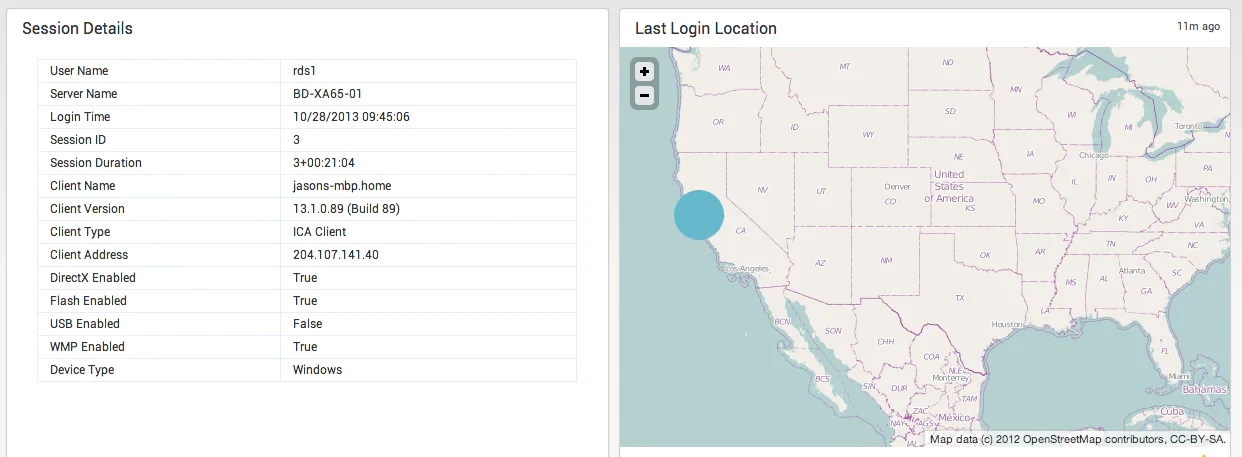
Today’s post will build two of my previous posts about pivoting a single row table and toggling visibility of dashboard panels. In the post about pivoting a table, one of the fields in the table was an IP address. Wouldn’t it be nice to run the iplocation command on the IP address and display where the user was logging in from on a map? Yeah, that would be cool, but only if we had something to map. Otherwise, we just have an empty map.
So, what we will be doing today is use a post process search on the IP address to get the geostats. Then, if this post process search returns results, we will dynamically display a dashboard panel with a map next to our table. Here is the end result:
Step 1 – The HTML
Here is the HTML for the table and map. Notice that the map <div> is set to hidden by default.
<div class="dashboard-row dashboard-row1">
    <div class="dashboard-cell" id="cell-detail" style="width: 100%;">
        <div class="dashboard-panel clearfix">
            <div class="panel-element-row">
                <div class="dashboard-element dataview" style="width: 100%">
                    <div class="panel-head">
                        <h3>Session Details</h3>
                    </div>
                    <div class="panel-body">
                        <div id="user-session-details"></div>
                    </div>
                </div>
            </div>
        </div>
    </div>
    <div class="dashboard-cell" id="cell-map" style="width: 0px; visibility: hidden; overflow: hidden">
        <div class="dashboard-panel clearfix">
            <div class="panel-element-row">
                <div class="dashboard-element map" id="map-login" style="width: 100%">
                    <div class="panel-head">
                        <h3>Last Login Location</h3>
                    </div>
                    <div class="panel-body"></div>
                </div>
            </div>
        </div>
    </div>
</div>
Step 2 – The Post Process Search
Here is the post process search I used for the map:
var postProcessMap = new PostProcessManager({ "search": 'iplocation "Client Address" | geostats count',
"managerid": "searchUserSession",
"id": "postProcessMap"
}, {tokens: true, tokenNamespace: "submitted"});
Step 3 – Show the Map (and resize the table) if there are results
Here is where the magic happens. If postProcessMap has any results (there may be no results if the IP address is an internal IP), then we need to resize the table to 50% and show the map element. Here is how that is done:
postProcessMap.on("search:done", function(properties) { if(properties.content.resultCount > 0) {
  // Show Map
  $("#cell-detail").css("width","50%");
  $("#cell-map")
    .css("visibility", "visible")
    .css("width", "50%");
  }
});