Originally posted on the Splunk official blog: https://www.splunk.com/en_us/blog/tips-and-tricks/monitor-processes-per-user-on-microsoft-remote-desktop-services-session-host.html
Microsoft Windows Remote Desktop Session Host (formerly Terminal Services) hosts multiple users on the same Windows Server Operating System. Therefore, all these users are sharing the same resources available to the OS. A lot of administrators want to know which processes belong to which user and how much resource allocation is used by each of these processes. This way, it is possible to determine power users or application resource hogs. This is useful in RDSH-based environments such as Citrix XenApp, Dell vWorkspace, Ericom, and more.
Step 1 – Index Process Information
The first thing to do is gather all the running processes and the desired metrics via inputs.conf. Here is a sample I use:
[perfmon://Process] interval = 10
object = Process
counters = % Processor Time; ID Process; Working Set - Private; IO Read Operations/sec; IO Write Operations/sec
instances = *
index= perfmon_index
disabled = 0
mode = multikv
Step 2 – Identify which Process belongs to which User
This previous inputs.conf stanza gathers the desired metrics for every process running on the server. However, we want to break this down by user. So, we need a way to link the unique process ID (called ID Process above) to a user name. To do this, we can look in WMI for this information. Here is an excerpt from wmi.conf to do just that:
[WMI:SessionProcess] interval = 10
disabled = 0
index = perfmon_index
wql = Select ProcessId, SessionId From Win32_Process
This WQL query will populate the index with the process ID and SessionId. The SessionId can be used to gather a wealth of information about the user, device, connection, etc.
Step 3 – Putting the Pieces Together
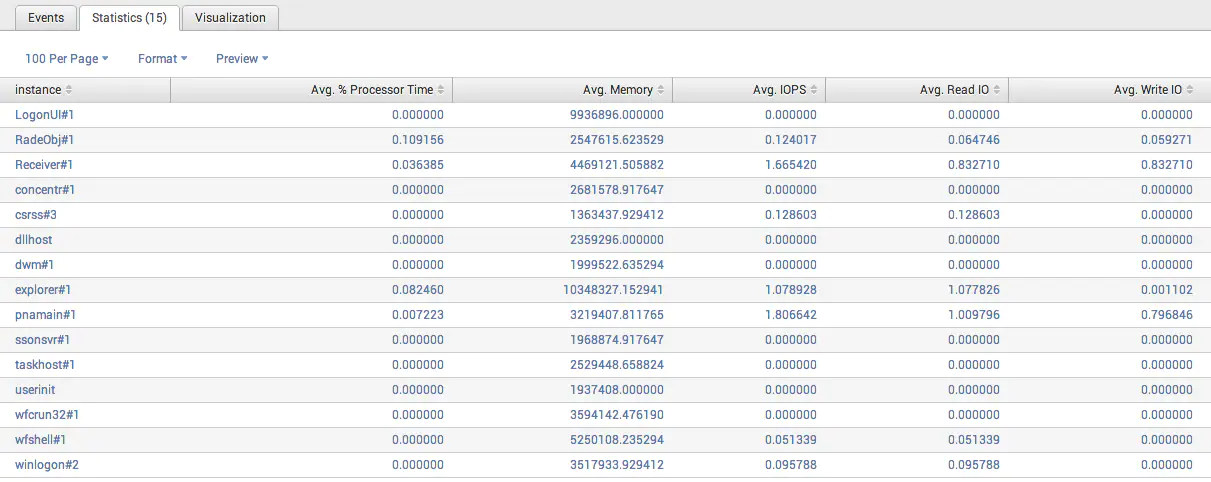
The last thing to do is create a search that will link all the information together. Here is a sample search:
index=perfmon_index host="host" sourcetype="PerfmonMk:Process" [search index=perfmon_index sourcetype="WMI:SessionProcess" host="host" SessionId="sessionId" | stats count by ProcessId | fields ProcessId | rename ProcessId AS ID_Process] | rename IO_Write_Operations/sec AS iowrite | rename IO_Read_Operations/sec AS ioread | eval iops = iowrite + ioread | stats avg(%_Processor_Time) AS "Avg. % Processor Time" avg(Working_Set_-_Private) AS "Avg. Memory" avg(iops) AS "Avg. IOPS" avg(ioread) AS "Avg. Read IO" avg(iowrite) AS "Avg. Write IO" BY instance
Here is the result: