Originally posted on the Splunk official blog: https://www.splunk.com/en_us/blog/tips-and-tricks/measuring-windows-group-policy-logon-performance.html
One of the common complaints you will hear from Windows users is that their logon takes too long. This is especially true for Microsoft Remote Desktop Services and Citrix infrastructures. Luckily, Microsoft is logging all the nitty-gritty details in Event Logs. So, naturally, Splunk can give you insight into what’s going on.
Getting the Event Log Data Into Splunk
The Windows event log holding this data is found under Applications and Services Logs > Microsoft > Windows > GroupPolicy > Operational.
Splunk has a built-in Windows Event Log collection mechanism, but that mechanism will not get the raw XML data behind the scenes of these entries. We need the extended XML data for our analysis. So, using a little PowerShell scripting, we can still get this data into Splunk.
The script I used can be found in the example app on GitHub here.
Analyzing the Event Log Data
Each new Windows logon will start with an Event ID of 4001. Also, each time a user logs on, Windows will assign a unique Activity ID to each log entry throughout the process. So, if we look for events with an Event ID of 4001, we can use the Splunk transaction command with the Activity ID to get the logon duration.
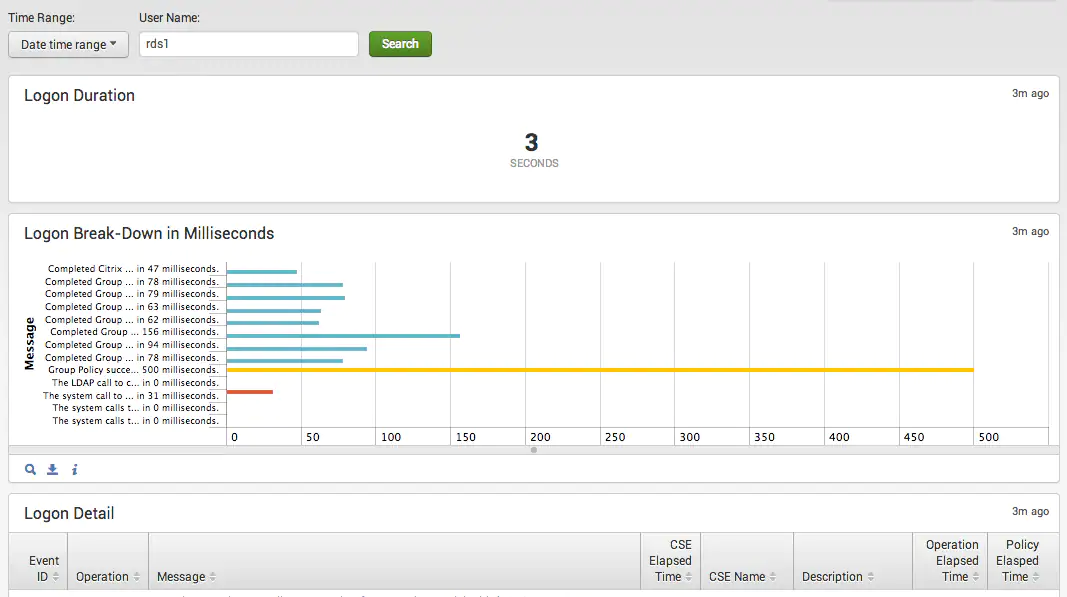
Putting it all Together
In the example GitHub app, there is a wizard to help you choose a specific login to examine. The drilldown on the wizard will take you to the analytics page and show you every step involved in the logon and how long each part takes (at least from a Windows perspective). This can help determine if certain things in your GPO are slowing your users down.
Download the GitHub project here.
For more information about Group Policy Event Logs, check out this article -> http://technet.microsoft.com/en-us/library/cc749336(v=ws.10).aspx