Originally posted on the Splunk official blog: https://www.splunk.com/en_us/blog/tips-and-tricks/monitoring-windows-service-state-history.html
For Microsoft Windows Operating Systems, it is extremely important that certain services are running to maintain functionality. For instance, if your Remote Procedure Call (RPC) Service is not running, your machine is most likely jacked up. This article will show you how to monitor Windows Services and get a history of service state change history.
Getting Windows Service Data into Splunk
In order to monitor Windows Services, we have to get that data into Splunk. There are basically 2 built-in ways to do this:
Method 1 – use WinHostMon
Install a Splunk Universal Forwarder on your Windows host and use a WinHostMon stanza in your inputs.conf file. Here is what it looks like:
[WinHostMon://Service]
type = service
interval = 300
index = {optional}
Check out the documentation for inputs.conf for all your options http://docs.splunk.com/Documentation/Splunk/latest/Admin/Inputsconf
Method 2 – use WMI
I like this method because I have more control on which services and what properties I want. This method can also be used on remote machines so a Splunk Universal Forwarder is not absolutely necessary on your Windows host you are querying.
Here is an example wmi.conf file running on a Windows host with the Splunk Universal Forwarder installed:
[WMI:Services]
interval = 300
disabled = 0
index = {optional}
server = {optional*}
wql = select Name, DisplayName, State, Status, StartName FROM Win32_Service
* the server parameter is where you would specify remote Windows host(s). If you do not specify anything here, the localhost will be used.
Check out the documentation for wmi.conf for all your options http://docs.splunk.com/Documentation/Splunk/latest/Admin/wmiconf
Getting Service State Change History
Now that we have the Windows Services data in Splunk, we can do some interesting searching/alerting.
Here is a search that displays the latest service state by host and service in the last 24 hours:
index={your index} sourcetype="WMI:Services" earliest="-24h@h" latest="now" |
	stats latest(State) AS State by host DisplayName |
	rename DisplayName AS "Display Name"
I like to keep a macro defining all the services I consider important so that I can see if anything is wrong more quickly. Here is and excerpt from my macros.conf file:
[Services-Inf]
definition = `Services-IMA` OR `Services-XTE` OR `Services-RDS`

[Services-IMA]
definition = Name="IMAService" OR Name="PolicyAgent" OR Name="RpcSs" OR Name="LanmanServer" OR Name="LanmanWorkstation" OR Name="IMAAdvanceSrv"

[Services-XTE]
definition = Name="CitrixXTEServer"

[Services-RDS]
definition = Name="TermService" OR Name="RpcSs"
Now, I can look for service state of just the infrastructure services like so:
index={your index} sourcetype="WMI:Services" `Services-Inf` earliest="-24h@h" latest="now" |
	stats latest(State) AS State by host DisplayName |
	rename DisplayName AS "Display Name"
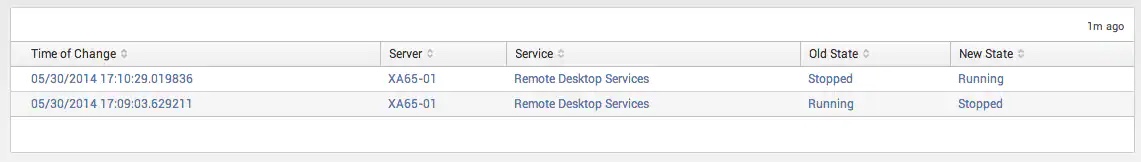
Finally, here is a search that will display the state history of a service (i.e. when the service has changed from running to stopped and vice versa):
index={your index} sourcetype="WMI:Services" host="{hostname}" DisplayName="{service display name}" |
	streamstats current=false last(State) AS new_state last(_time) AS time_of_change BY DisplayName |
	where State != new_state |
	convert ctime(time_of_change) AS time_of_change |
	rename State AS old_state |
	table time_of_change host DisplayName old_state new_state |
	rename time_of_change AS "Time of Change" host AS Server DisplayName AS Service old_state AS "Old State" new_state AS "New State"
Here is the end result. You can see from the table when the Remote Desktop Services service changed from Running to Stopped, and then from Stopped to Running.
I basically stole an example about tracking when a DHCP issued IP address changed using stream stats from this blog post and applied it here.