An alternate title to this article might be “How Steve Greenberg and I Pulled off the Robo-Kitty Monitor Alerts at Citrix Synergy Geek Speak Tonight”.
In case you missed it, here it is below:
[embed]https://www.youtube.com/watch?v=-9jTeWQbVYE&t=54m21s[/embed]
The Demo Scenario
Anyway, Octoblu does some incredible stuff with physical things driven by software. In the demo that Steve and I did, Steve set up an actual desk with various IoT devices on it. We will call this the “IoT Workspace”. The IoT Workspace had a digital picture frame, lights that can change color, a mini file cabinet (that held business cards), a maneki-neko (a.k.a. lucky cat) with several hacked features, a smoke machine, and more. We started the IoT Workspace using proximity (look for another article about how we did that soon). Then, I had a Splunk instance monitoring a Citrix stack including network, XenApp, hypervisors (XenServer, Hyper-V, and VMware), physical hardware (in this case Cisco UCS), shared storage, NetScaler, etc. At the beginning of the demonstration, the environment was all-good so everything glowed green, the Robo-Kitty was happy, and the picture frame on the desk showed an array of our favorite pictures (see below):
[caption id=”attachment_1641” align=”aligncenter” width=”300”] IoT Workspace[/caption]
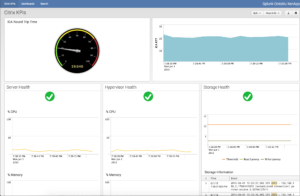
[caption id=”attachment_1628” align=”aligncenter” width=”300”] Splunk Dashboard (All Good)[/caption]
Then, the ICA Round Trip Time started to go up. Nothing terrible, but we used that as an indicator that our users might start seeing some lag in their sessions. This is where Splunk fired the first Octoblu trigger to go to a “yellow” state. The picture frame showed a worried Minion, lights turned yellow, and Robo-Kitty’s eyes turned yellow and started to swivel.
Next, Splunk showed problems with the XenApp servers and hypervisors in addition to the ICA Round Trip Time. So, Splunk triggered a “red” state. The Minion in the picture frame looked more worried, lights turned red, and Robo-Kitty’s eyes turned red and around faster.
Finally, the entire stack went to pot. The write latency on the storage array went through the roof, the hypervisors were not happy, the XenApp server resources were scarce, the ICA Round Trip Time was off the chart. Splunk triggered the “defcon red” state. Robo-Kitty shot lasers out of its chest, the storage cabinet on the IoT Workspace started to rattle, smoke was coming out of the desk. The culprit ended up being a write controller issue on the shared storage. Once everything was fixed, Splunk triggered the “green” state again.
How it Works
Steve did all the physical work building the IoT Workspace by hooking up Raspberry Pi, Gateblu, servos, lights, etc. Check out his article for more info -> http://www.thinclient.net/blog/?p=473. Steve also built the Octoblu flows to make all that stuff work.
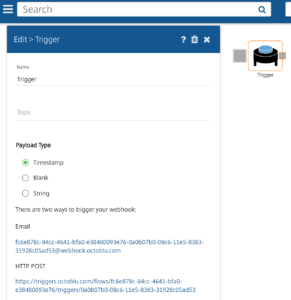
I hooked up the Octoblu triggers in Splunk to kick off all these connected devices. A trigger generally initiates Octoblu flows. These triggers have HTTP POST URLs that can be used to remotely initiate the flows (see screen shot). This is how I had Splunk act upon the data seen in the Citrix stack.
I ran a Splunk real-time search and triggered a Python script that initiated the HTTP POST with data from the Splunk search to Octoblu when certain conditions happened. For example, if the ICA Round Trip Time exceeds 30ms and is less than 60ms, trigger a yellow alert condition. Here is the Splunk search:
sourcetype=ICA:RTT ICARTT > 30 ICARTT < 60 | eval url="<HTTP POST URL for the Octoblu trigger>" | eval alert_level="Yellow"
If you are interested, I have the entire Splunk/Octoblu example I used uploaded to GitHub. You can also download and use Splunk for free. There is a data generator built in there as well that will let you trigger different conditions like I did in the demo.
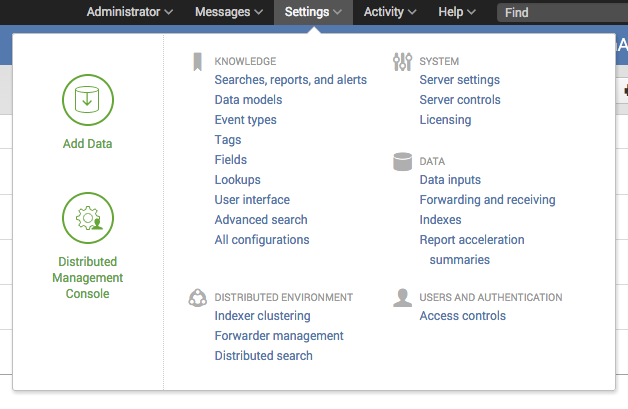
The magic happens in the saved search and a python scripted named octoblu_trigger.py. The saved search contains the HTTP POST url and the condition. The python script takes those parameters from the search and sends it over to Octoblu. If you want to play around with this on your own system, be sure to edit the saved search by opening the Octoblu app in Splunk and clicking Settings -> Searches, reports, and alerts:
 Click on the example alert and change the URL to your Octoblu trigger URL.
Conclusion
Anyway, there you go. It may look kind of complicated at first, but really it is quite easy to trigger any Octoblu workflow given a variety of trigger situations.
