Originally posted on the Splunk official blog: https://www.splunk.com/en_us/blog/tips-and-tricks/iot-and-flying-ponies-at-conf-2015.html
One of the coolest demos I witnessed at Splunk .conf 2015 was the one by Nate McKervy. The reasons this demo was so cool is 1) it was live, 2) it involved audience participation, and 3) it involved shooting stuffed ponies out of an air cannon. This article will explain a little more of what was going on under the covers.
Skip to 19:18 for the demo
Getting Data from the Audience
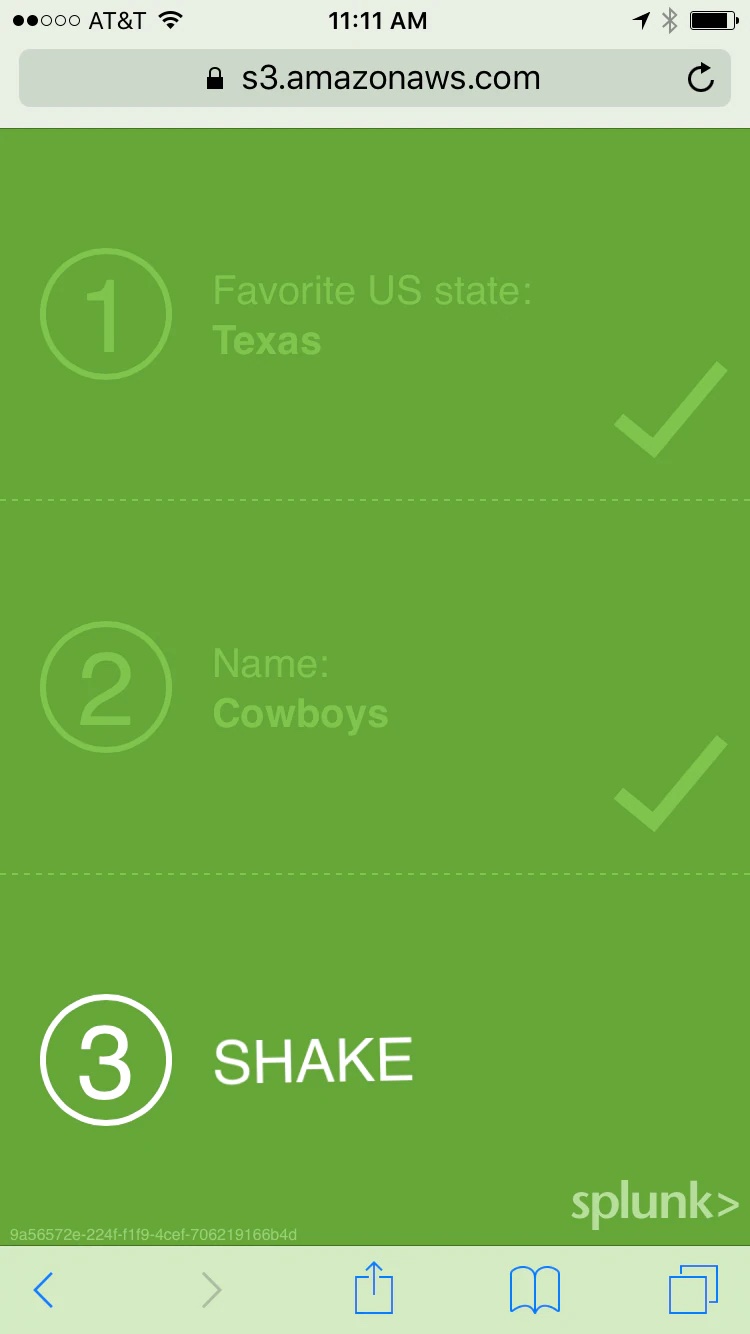
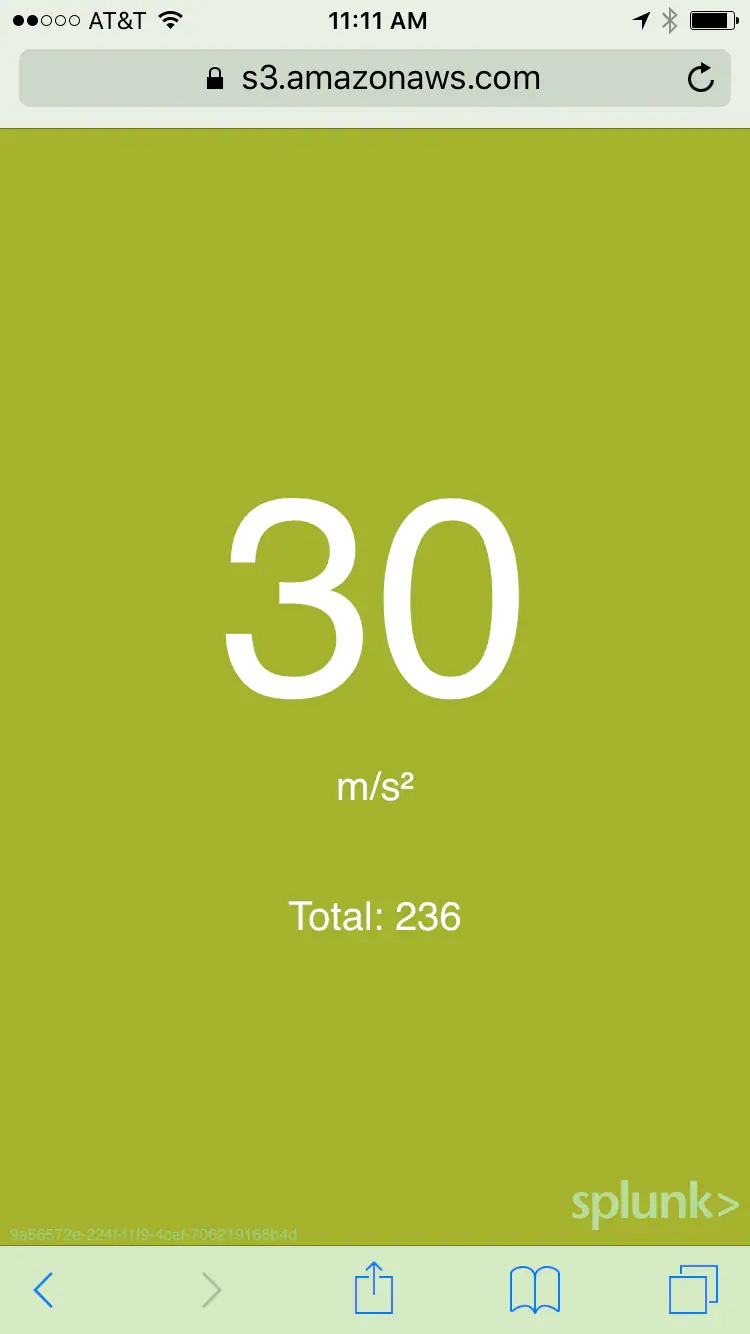
To kick off this live demo, some data was needed. What better way to get real data than to get the audience involved? To do this, a mobile website was created that prompted for a couple of questions and then instructed you to shake your mobile device (in case you are wondering, the ondevicemotion event handler was used to measure the shakiness. In fact, you can get the whole mobile app source code from GitHub). This mobile website sent data to Splunk via the new HTTP Event Collector in real time. Boom – live data!
Analyzing the Data from the Audience
Ok, now that we have this live data, it is time to start asking questions. You can see in the video some of the analytics Nate pulled off in real time, including:
- Number of users shaking
- Trend – i.e. how much shaking is going on over time
- Who is shaking the most
- The new Choropleth visualization shows what states are shaking
- Devices shaking
Firing the Air Cannon from Splunk
You’ll notice at the beginning of the demonstration that there is a filler gauge visualization. This gauge is wired to an Octoblu modular alert that sends a signal to an Octoblu-powered T-Shirt cannon when the gauge hits 100%. This T-Shirt cannon is filled with stuffed Splunk ponies. It is a little hard to see in the official video, but I was able to capture it with my phone (sorry for the quality as I was pretty far back in the room).
Ponies fly at #splunkconf @octoblu @chrismatthieu @chrisfleck @pcrampton @virgilvox pic.twitter.com/HjLpiDdJcz
— Jason Conger (@JasonConger) September 22, 2015
Recap
To recap, shaking mobile devices sent real-time data to Splunk via the HTTP event collector. All sorts of new visualizations are available to analyze the data. The new modular alert framework fired off an Octoblu workflow to send those ponies flying. Splunk is fun!