Originally posted on the Splunk official blog: https://www.splunk.com/en_us/blog/tips-and-tricks/splunking-microsoft-azure-network-watcher-data.html
Microsoft has released a new service in Azure called Network Watcher. Network Watcher is a network performance monitoring, diagnostic, and analytics service which enables you to monitor your network in Azure. The data collected by Network Watcher is stored in one or more Azure Storage Containers. The Splunk Add-on for Microsoft Cloud Services has inputs to collect data stored in Azure Storage Containers which provides valuable insights for operational intelligence regarding Azure network workloads. In this blog post, we will explore how to get Azure Network Security Group (NSG) Flow Logs into Splunk and some possible use case scenarios for the data.
Getting Azure NSG Flow Log data into Splunk
NSG flow logs allow you to view information about ingress and egress IP traffic on their Network Security Groups. These flow logs show the following information:
- Outbound and Inbound flows on a per Rule basis
- Which NIC the flow applies to
- Tuple information about the flow (Source/Destination IP, Source/Destination Port, Protocol)
- Information about whether the traffic was allowed or denied
Getting Azure NSG Flow Log data into Splunk involves two basic steps:
- Configure NSG Flow Logs in the Azure Portal
- Setup the Splunk Add-on for Microsoft Cloud Services to read the NSG Flow logs from the specified Azure Storage Container from step 1
Configuring NSG Flow Logs in the Azure Portal
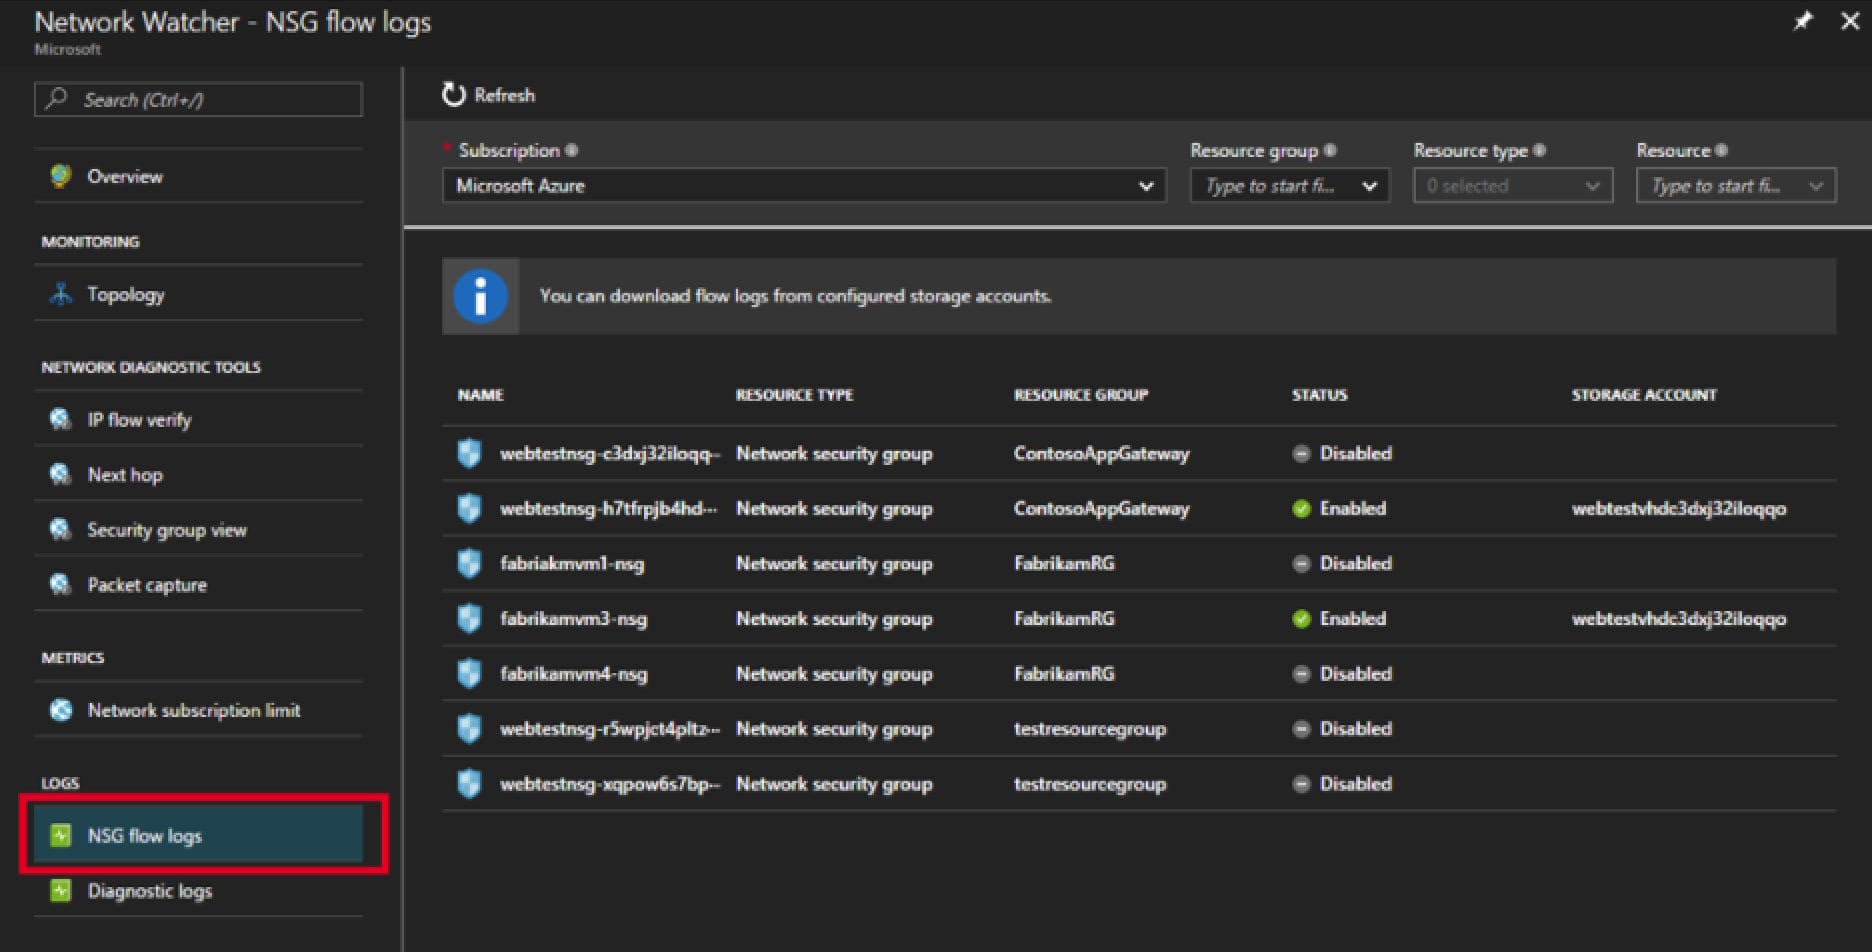
From the Azure Portal, navigate to a Network Watcher instance and select Flow Logs
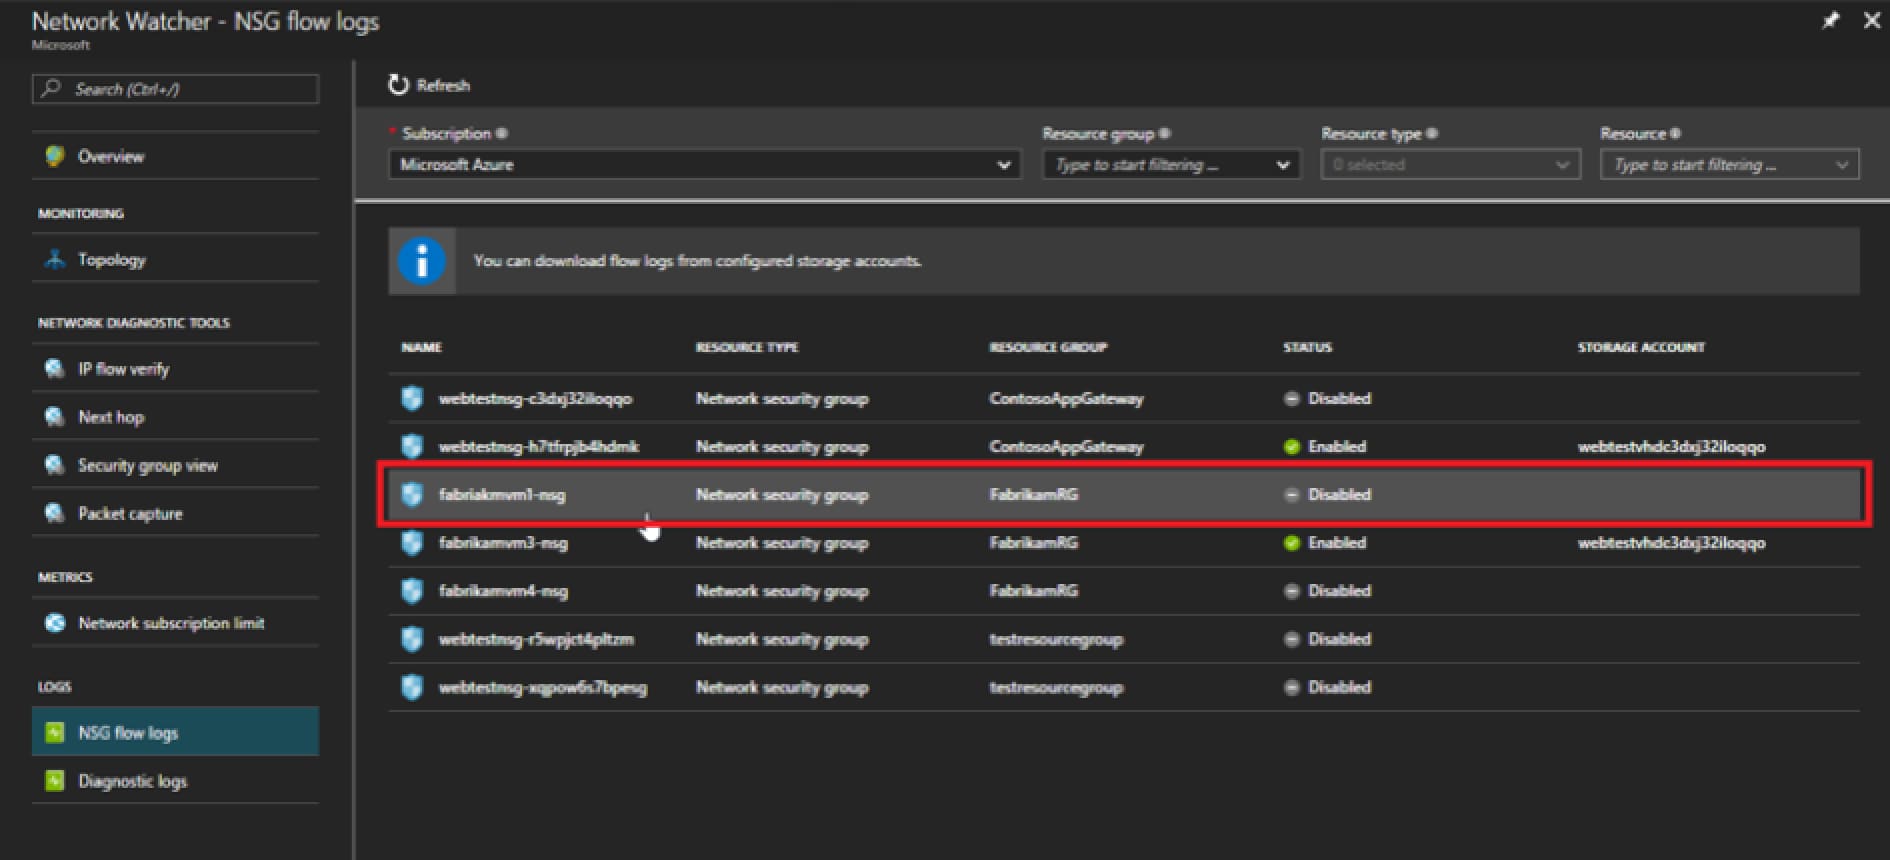
Select a Network Security Group from the list by clicking it.
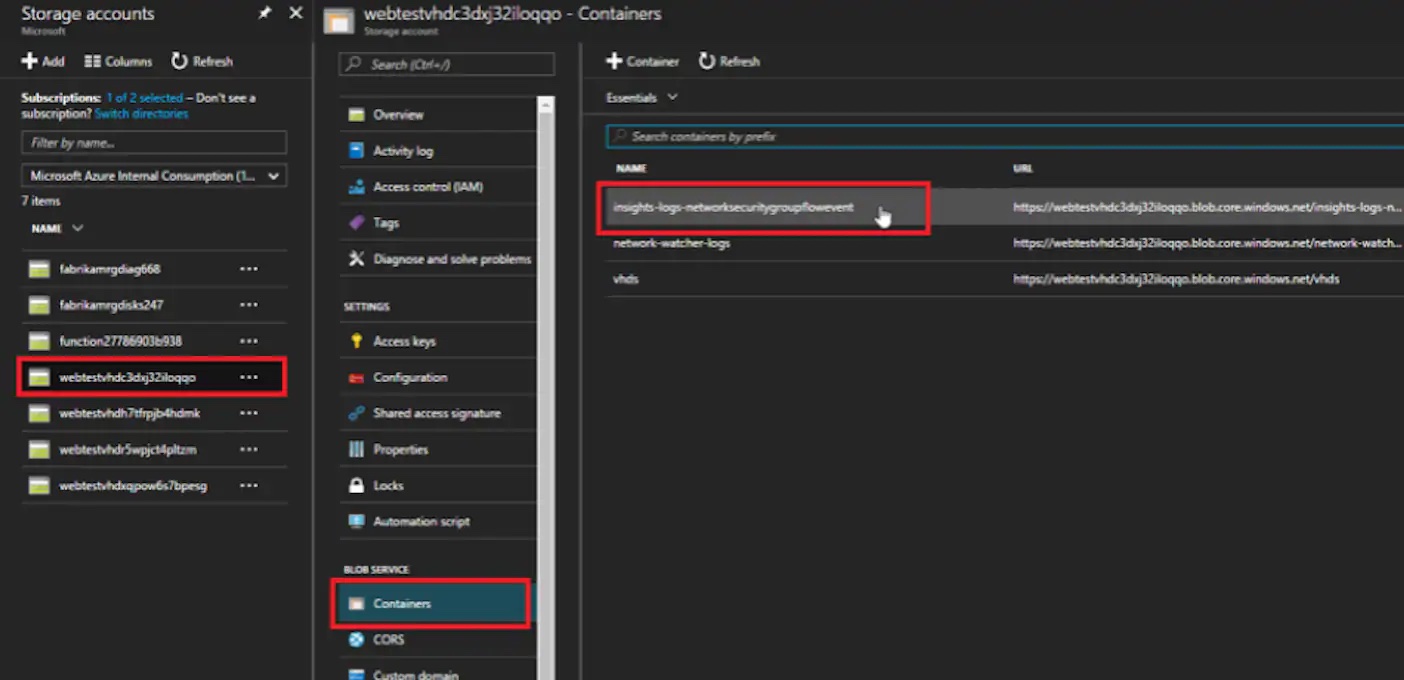
Navigate to the correct storage account and then Containers -> insights-logs-networksecuritygroupflowevent
Configuring the Splunk Add-on for Microsoft Cloud Services to ingest NSG Flow Logs
Download and install the Splunk Add-on for Microsoft Cloud Services in accordance with the documentation.
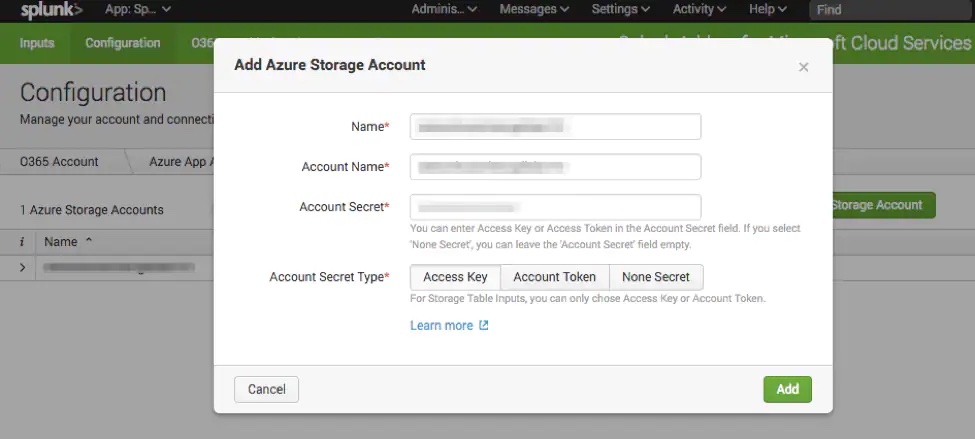
After installation of the add-on, connect the add-on to the Azure Storage Account specified above.
The NSG Flow Log data is kept in an Azure Storage blob container named insights-logs-networksecuritygroupflowevent.`
Configure an Azure Storage Blob input for this container.
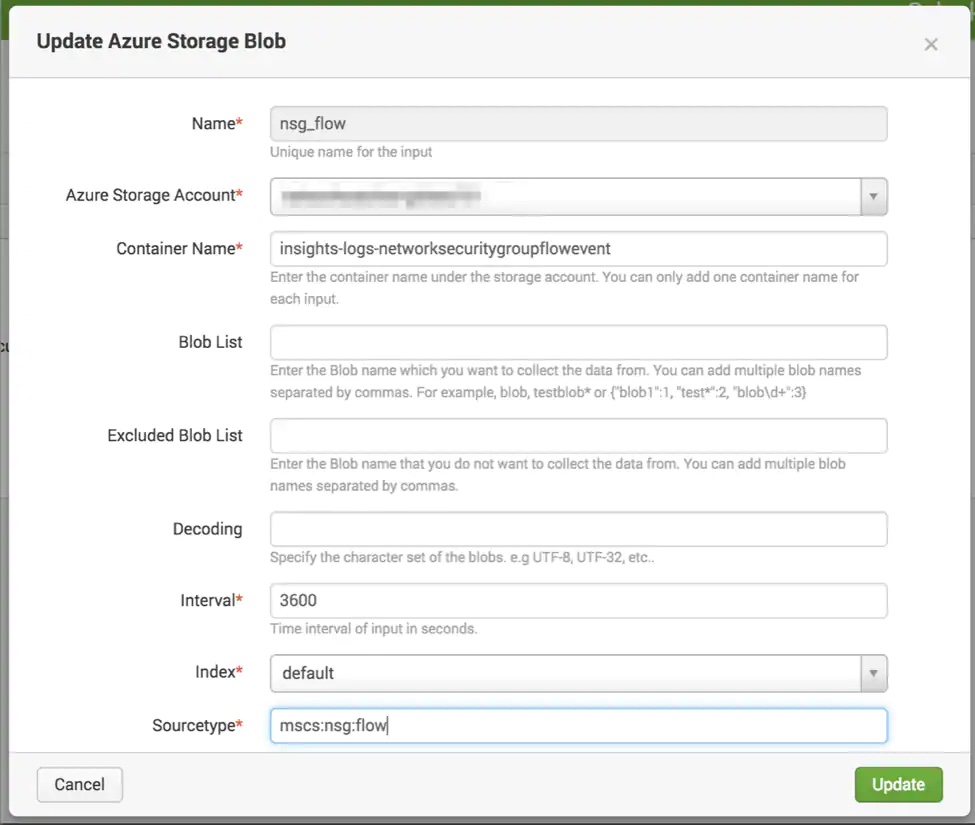
Notice that the sourcetype is set to mscs:nsg:flow. You do not have to set your sourcetype to this. I just chose this as an easy way to differentiate the data. Here is a handy props.conf configuration to break the JSON array into individual events:
[mscs:nsg:flow]
LINE_BREAKER = \}([\r\n]s*,[\r\n]s*){
SEDCMD-remove_header = s/\{\s*\"records\"\:s*\[\s*//g
SEDCMD-remove_footer = s/\][\r\n]\s*\}.*//g
SHOULD_LINEMERGE = false
KV_MODE = json
TIME_PREFIX = time\":\"
REPORT-tuples = extract_tuple
Here is a handy transforms.conf delimiter for the tuples in the data:
[extract_tuple]
SOURCE_KEY = properties.flows{}.flows{}.flowTuples{}
DELIMS = ","
FIELDS = time,src_ip,dst_ip,src_port,dst_port,protocol,traffic_flow,traffic_result
Searching the NSG Flow Log Data with Splunk
Once the input from above is created, the NSG Flow Log data will be available to search in Splunk. Some potential use cases for this data include:
Monitoring Protocols – this is a security and compliance use case. Ensure only the correct protocols are in use and monitor the traffic usage of each protocol over time.
sourcetype=mscs:nsg:flow | top protocol by dst_ip
Monitoring Traffic Flow – this is useful to identify potential rouge communication. For instance, if a source machine in your Azure environment exhibits destination traffic to a known bad address, this could indicate potential malware.
sourcetype=mscs:nsg:flow | stats count by src_ip dst_ip
This search could be visualized on a Sankey Diagram as well to visualize the flow.
Monitoring Allowed vs. Denied Traffic – this could indicate an attack or a misconfiguration. If you are seeing a lot of denied traffic, this could indicate a misconfiguration of software that is trying to communicate with your Azure resources.
sourcetype=mscs:nsg:flow | stats count by traffic_result src_ip
Top Destination Addresses/Ports – this is useful for security and monitoring usefulness of services hosted in Azure
sourcetype=mscs:nsg:flow |top dst_port by dst_ip
Conclusion
Even though NSG Flow Logs are a new data source made available by Microsoft Azure, the Splunk Add-on for Microsoft Cloud Services is ready to ingest this data source today in order to give you an even greater degree of operational insight and intelligence for you Microsoft Azure environment.