 version 2.0
Got Citrix Resource Manager? Try out Web Interface for Resource Manager!
Web Interface for Resource Manager is an ASP.NET 2.0 web application that contains several SQL queries to display useful information contained in the Citrix Resource Manager Summary Database. Web Interface for Resource Manager displays this information in a drill-down graphical and tabular manner.
What's new in version 2.0?
Web Interface for Resource Manager version 2.0 includes everything in version 1.2, plus the following new features:
- Concurrent usage of applications report
See the concurrent usage of you applications within a specified date range. Also, this report will show you when the maximum number of concurrent sessions was reached. - Server metrics report
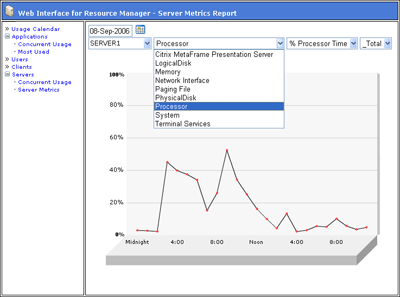
See captured metrics for a particular server on a specified date. Any metrics you capture via the Citrix Presentation Server Console will be reported here. - Concurrent usage of servers report
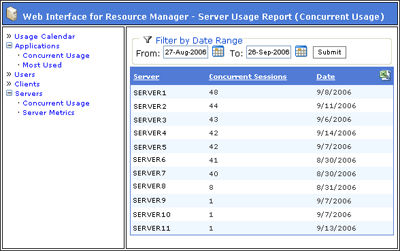
See how many concurrent sessions you are getting per server within a date range. This report will also show you when this max count was reached. Clicking on a row in this report will take you to the server metrics report for the particular date you reached the max count – showing you how your server was performing under the load. - Exporting reports
You can now export reports to CSV for further analysis using an application such as Microsoft Excel - New calendar filtering option
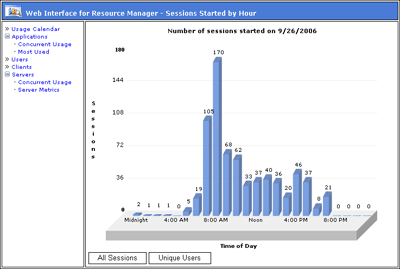
A new option on the Usage Calendar allows you to view all sessions that started per hour on a given day, or just unique users per hour. For example, if user1 started 2 or more sessions during the 11:00 hour, user1 would only be counted one time.
 Download Web Interface for Resource Manager version 2.0 (for Presentation Server 3.0 and above)
What's on the radar for the future?
- Graphical configuration – no more editing Web.Config by hand.
- Multiple language support.
- Oracle Database support.
- And, of course, more reports.
 Known issues
If all database tables are not owned by dbo, you will receive errors. For more explanation on this phenomenon, see this article.
If you do not properly set up your database authentication, you will not be able to view any reports. Please refer to this article for database authentication guidelines.
Note: Version 2.0 is only intended for Presentation Server 3.0 and above. This is due to the differences in the Resource Manager Summary Database schema. The MetaFrame XP Summary Database schema does not include the tables necessary to generate these new reports. Please use Web Interface for Resource Manager Version 1.1 for MetaFrame XP.
Screen Shots of Web Interface for Resource Manager
New buttons on the Sessions by Hour graph to show all sessions or just unique user sessions
(filters out multiple sessions started by the same user in the same hour). 
![]() Click to enlarge
Click to enlarge
Report showing max concurrent sessions per server and the date this max count was reached. 
![]() Click to enlarge
Click to enlarge
Report showing server metrics for a specified day. 
![]() Click to enlarge
Click to enlarge